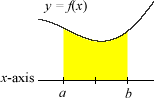
The area between
the graph of y = f(x)
and the x-axis is given by the definite
integral below. This formula gives a positive result
for a graph above the x-axis, and a
negative result for
a graph below the x-axis.
Note: If the graph
of y = f(x) is
partly above and partly below the x-axis, the formula
given below generates the net area. That is, the area above
the axis minus the area
below the axis.
Formula:
Example 1:
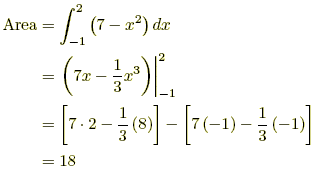
Find the area between y = 7 – x2 and
the x-axis
between the values x = –1 and x =
2.
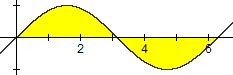
Example 2:
Find the net area between y = sin x and
the x-axis between the values x = 0
and x = 2π.
A = The net (signed) area between the curve and the x-axis over the interval [a, b]
f(x) = The function whose graph forms the curve
a = The lower limit (left boundary) of the interval
b = The upper limit (right boundary) of the interval
Worked Example
Problem: Find the area between y = 7 − x² and the x-axis from x = −1 to x = 2.
Step 1: Set up the definite integral with the given function and limits.
A=∫−12(7−x2)dx
Step 2: Find the antiderivative of 7 − x².
F(x)=7x−3x3
Step 3: Evaluate the antiderivative at the upper limit x = 2.
F(2)=7(2)−323=14−38=342−8=334
Step 4: Evaluate the antiderivative at the lower limit x = −1.
F(−1)=7(−1)−3(−1)3=−7+31=3−21+1=3−20
Step 5: Subtract the lower-limit value from the upper-limit value.
A=334−3−20=334+20=354=18
Answer: The area between y = 7 − x² and the x-axis from x = −1 to x = 2 is 18 square units.
Another Example
This example shows the important case where the curve crosses the x-axis within the interval. A single definite integral would give only the net area (−16/3 + 7/3 = −3), which is not the total geometric area. You must split the interval at each x-intercept and sum the absolute values.
Problem: Find the total (unsigned) area between y = x² − 4 and the x-axis from x = 0 to x = 3.
Step 1: Find where the curve crosses the x-axis by solving x² − 4 = 0. The roots are x = −2 and x = 2. Within the interval [0, 3], the crossing point is x = 2. The function is negative on [0, 2] and positive on [2, 3].
x2−4=0⟹x=±2
Step 2: To get total area (not net area), integrate each piece separately and take absolute values. First, compute the integral from 0 to 2.
∫02(x2−4)dx=[3x3−4x]02=(38−8)−0=−316
Step 3: The integral is negative because the curve is below the x-axis. Take the absolute value to get the area of this piece.
−316=316
Step 4: Now compute the integral from 2 to 3, where the curve is above the x-axis.
Answer: The total area between y = x² − 4 and the x-axis from x = 0 to x = 3 is 23/3 ≈ 7.67 square units.
Frequently Asked Questions
What is the difference between net area and total area under a curve?
Net area is the value you get directly from the definite integral ∫ f(x) dx — regions below the x-axis contribute negative values that partially cancel regions above. Total area treats every region as positive, so you split the integral at each x-intercept and take the absolute value of each piece before adding. If the curve stays entirely above (or entirely below) the axis on the interval, net area and total area differ only by a sign.
How do you find the area under a curve when the function is below the x-axis?
When f(x) < 0 on an interval [a, b], the definite integral ∫ₐᵇ f(x) dx returns a negative number. To find the positive geometric area, take the absolute value of the integral, or equivalently integrate −f(x) instead. If part of the curve is above and part is below the axis, split the integral at each zero crossing.
Why does the definite integral give the area under a curve?
The definite integral is defined as the limit of Riemann sums — sums of the areas of thin rectangles that approximate the region under the curve. As the rectangles become infinitely narrow, their total converges to the exact area. This connection between integration and area is formalized by the Fundamental Theorem of Calculus.
Area under a Curve vs. Area between Curves
Area under a Curve
Area between Curves
Definition
Region between y = f(x) and the x-axis
Region between two curves y = f(x) and y = g(x)
Formula
∫ₐᵇ f(x) dx
∫ₐᵇ |f(x) − g(x)| dx
When to use
One function and the x-axis as a boundary
Two functions forming the upper and lower boundaries
Sign issues
Negative when curve is below x-axis
Absolute value handles which curve is on top
Why It Matters
Area under a curve is one of the first major applications of integration you encounter in calculus. It appears in physics (work done by a variable force, displacement from a velocity-time graph), in statistics (probabilities under a probability density function), and in economics (consumer and producer surplus). Mastering this concept builds the foundation for more advanced integral applications such as volumes of revolution and arc length.
Common Mistakes
Mistake: Using a single integral over the entire interval when the curve crosses the x-axis, and reporting the result as the total area.
Correction: A single definite integral gives the net (signed) area. To find the total geometric area, identify where f(x) = 0 within [a, b], split into sub-intervals, and add the absolute value of each integral.
Mistake: Forgetting to evaluate the antiderivative at both limits and subtract correctly (especially with negative lower limits).
Correction: Always compute F(b) − F(a) carefully. When a is negative, substituting it into polynomial terms can change signs unexpectedly. Write out each substitution step to avoid arithmetic errors.